In my last two posts about reports, I explained how can we develop & deploy reports using Business Intelligence Development Studio (BIDS). But I think that even though I titled it as 101, it was not as easy as it sounds. Because there is even easier way exists to create a report that is by using Report Wizard. This wizard guides user at every step and they can create simple report with few clicks and even without being much “expert” at it. In today’s post, I will explain how can we use Report Wizard to create report.
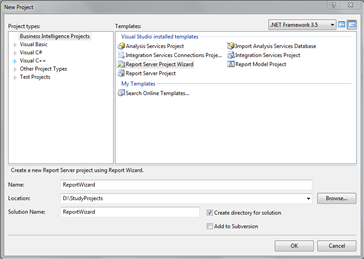
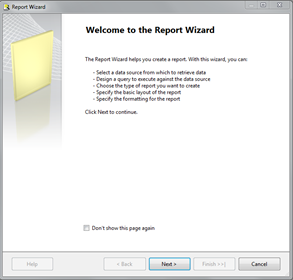
Before doing anything, we need to create new reporting project from BIDS section of VS 2008. And select Report Server Project Wizard. Once we enter name and location of project and clicks OK, a wizard appear and thus our journey begins.
 |
 |
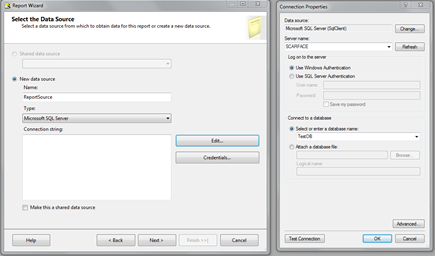
First step is to create datasource for our report, which is basically connection to database.
 |
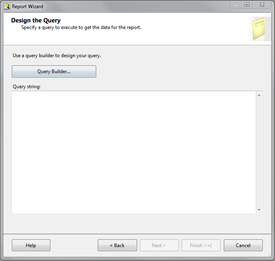 |
Next step is to design query using query designer, here you will have option to either write query or use “Query Builder” to build the SQL query.
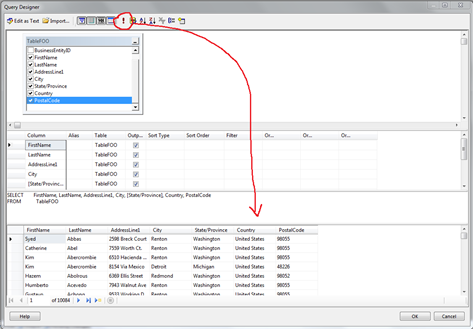
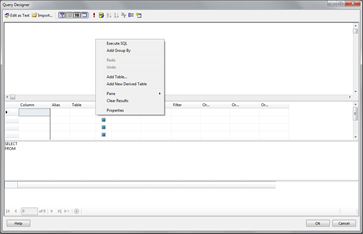
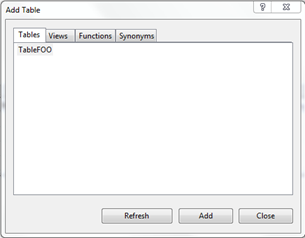
When we click on Query Builder button, it opens up query designer window. Here we need to right click to add new table from database. Here we can add one or more tables which will be used to build query for report. We can also use other DB objects as data sources like Functions and Views and SPs. Since I have only one table, I will add this table and now query designer window will have this table selected.
 |
 |
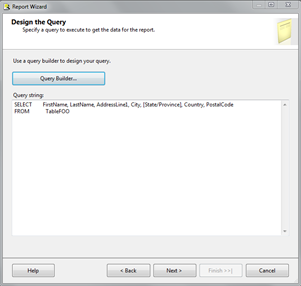
Next step is to select which columns we want to show for our report since I have only one table, I just need to select columns using checkboxes next to them. I can build complex queries using joins as well.
In the top toolbar there is ! sign button which can be used to query table and result will be displayed at very bottom section of query designer. This is very handy feature to verify that you are getting proper data from your query.
Once clicked on OK, we get back to main query design screen. Next options will be more familiar as they are same as of any regular report designing (can be checked from past report designing post).
 |
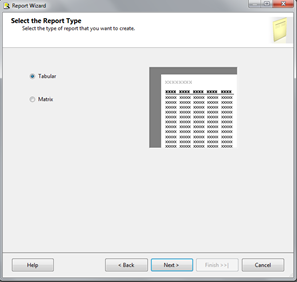 |
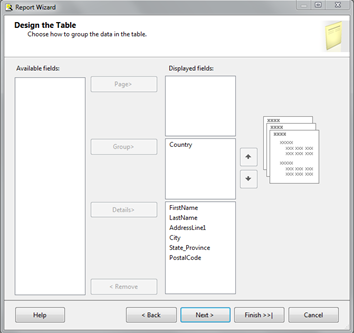
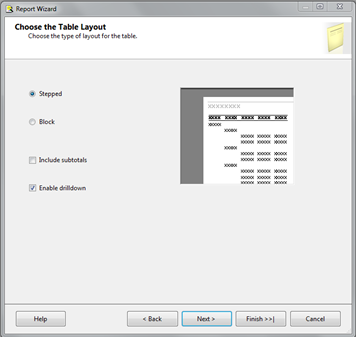
Next select report type as Table. And add required fields in their position, here I wanted to group fields based on Country and I also want report be able to drilldown, which can be done by selecting options on layout screen.
 |
 |
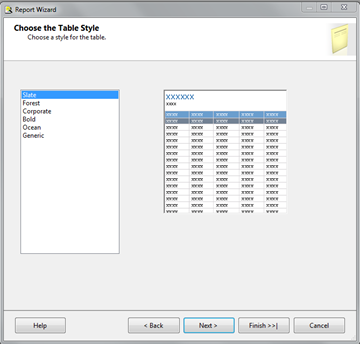
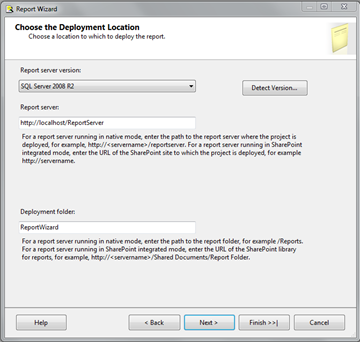
Next screen will allow us to select theme for our report. Last screen gives options about report deployment settings like deployment folder, report server URL, report server version etc.
 |
 |
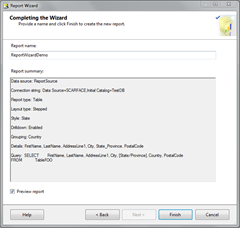
By clicking finish this report wizard ends and it generates report for us. I had selected “Preview Report” checkbox so I was presented with preview once report is generated.
 |
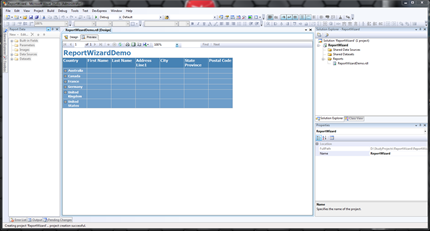 |
As you can see after all of these steps we get all well built report ready to be deployed to configured report server.
It can be seen that this report wizard is very basic, it doesn’t gives us ability to do much customization like adding sub report or add image or something similar. But on the other hand this is really handy because, if you need to create quick and simple report it is way more faster and easier then doing manual labor.
Here ends this step by step tutorial of Report Wizard to create simple report. Code can be downloaded from here
It’s Just A Thought … ![]()

